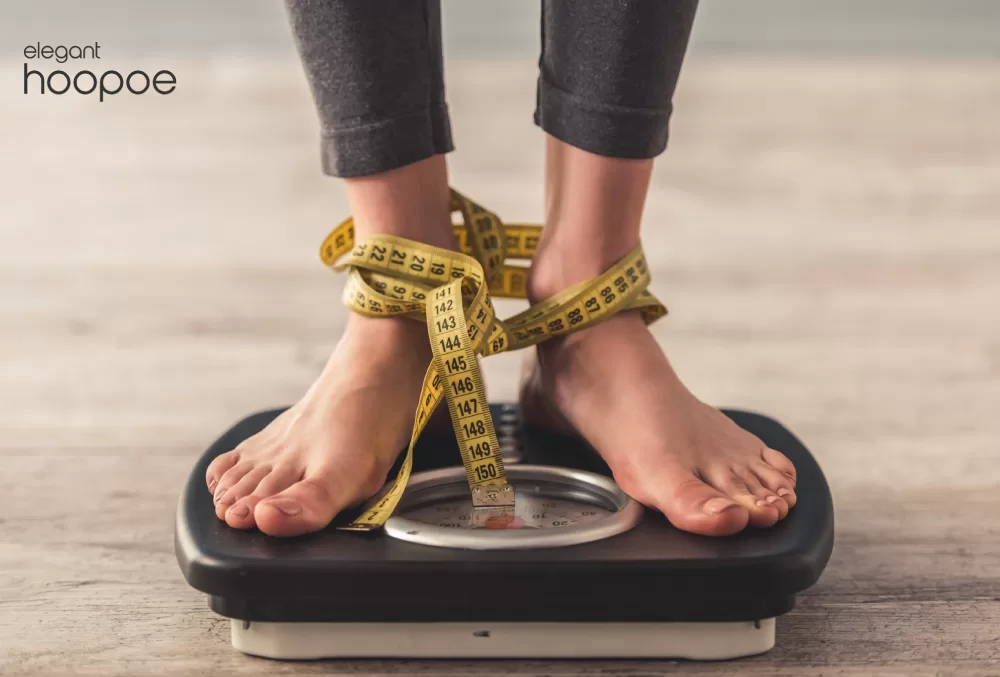
A healthy weight means a healthy body, but most people do not really know how much should be their body weight and their goal is just to lose or gain some pounds, and this might result in some disadvantages over time. Hence, it is essential to know what is your ideal body weight and how much you should weigh. In this blog post, we are going to explain what ideal weight is depending on age, gender, and other factors.
Ideal Body Weight for You
When it comes to weight, it is not a one-size-fits-all matter, and there is no such thing as an ideal body weight that can be applied to all people. Each individual has a different body structure, and the distribution of fat, muscle, skeleton, water, and other things in their body. Determining these factors can help you to figure out your ideal weight.
Struggling to lose weight? Read about how to lose weight fast and safe without surgery.
Fat distribution in a body and the total amount of fats is a considerable part of the overall weight. Multiple studies suggest that you should keep your body fat at a certain level to maintain your health and decrease the chance of numerous diseases. High level of body fat is associated with chronic low-grade inflammation, which can lead to type 2 diabetes, heart problems, and even Alzheimer’s. On the other hand, a low level of body fat also comes with disadvantages such as:
- Increased risk of heart problems
- Low energy level
- Feeling cold regularly
- Less effective workouts
- Low muscle recovery rate
- Testosterone drop
- Weaker muscles
- Mood and Hormonal imbalances
- Constant hunger
- Poor Vitamin absorption
- Increased risk of infection
It is best to maintain body fat levels within an average suggested percentage, and there is no exact number even for an individual. According to clinical data, it is best for women aged 21 to 39 with a normal body weight range to have a body fat percentage of around 21-32%, and for men, a body fat percentage of 8 to 20% is recommended.
Another study suggested that in adults aged 45 to 64, the body fat percentage should be 25.8% for men and 37.1% for women. It also reported that a significantly higher rate of body fat can notably increase the risk of heart disease, high blood pressure, and type 2 diabetes.
It is essential to know that factors like age, sex, ethnicity, and height all play a part in determining the ideal body fat percentage for individuals. There are different ways to assess body fat percentage, such as BMI, waist-hip ratio, waist circumference, and skinfold measurements. The World Health Organization suggests that women should keep their waist circumference under 31.3 inches and men under 35.4 inches.
How to calculate the ideal body weight range?
Remember that what you consider the best or goal weight might not be realistic or healthy after all; body weight is just another piece of the puzzle that makes overall health. The ideal weight range is the one that can help you reach optimal mental and physical health. Staying in that range will significantly reduce the risk of any type of disease, especially those related to body weight, like sleep apnea, blood pressure, and joint problems.
It is best to consult with a professional dietitian to determine what a healthy weight is for you.
The best way to calculate the ideal body weight range is to use BMI despite the limitations and flaws it has. The Body Mass Index uses height and weight to give an overall health classification. The main problem with this method is that it can not differentiate between body fat and muscle mass, and it is unable to measure fat distribution. For instance, someone with more muscle mass and healthy body fat might be considered to be overweight by this method; conversely, someone with too much body fat and too little muscle mass might fall in the healthy range.
It is best to combine this method with other tests, such as blood tests and waist circumference, to assess the healthy body weight range for each person.
Ideal body weight based on gender and age
These tables show what should be the ideal weight for men and women based on their age.
| Age (years) | Lower percentile weight (lbs) | “Average” percentile weight (lbs) | Upper percentile weight (lbs) |
| 2–3 | 23–27 or less | 24–34 | 32–7 lbs or higher |
| 3–4 | 27–30 or less | 28–39 | 37–42 or higher |
| 4–5 | 30–34 or less | 31–45 | 42–49 or higher |
| 5–6 | 34–37 or less | 35–50 | 49–56 or higher |
| 6–7 | 37–41 or less | 39–57 | 56–63 or higher |
| 7–8 | 37–45 or less | 43–63 | 63–72 or higher |
| 8–9 | 45–50 or less | 47– 71 | 72–81 or higher |
| 9–10 | 50–55 or less | 52–80 | 81–92 or higher |
| 10–11 | 55–61 or less | 58–91 | 92–105 or higher |
| 11–12 | 61–67 or less | 64–103 | 105–119 or higher |
| 12–13 | 67–75 or less | 71–116 | 119–133 or higher |
| 13–14 | 75–85 or less | 80–129 | 133–147 or higher |
| 14–15 | 85–95 or less | 90–141 | 147–160 or higher |
| 15–16 | 95–104 or less | 100–152 | 160–171 or higher |
| 16–17 | 104–112 or less | 110–160 | 171–181 or higher |
| 17–18 | 112–117 or less | 117–166 | 181–187 or higher |
| 18–19 | 117–121 or less | 123–171 | 187–192 or higher |
| 19–20 | 121–122 or less | 126–174 | 192–195 or higher |
Females chart
| Age (years) | Lower percentile weight (lbs) | “Average” percentile weight (lbs) | Upper percentile weight (lbs) |
| 2–3 | 22–26 or less | 23–33 | 31–36 or higher 13.93–16.46 |
| 3–4 | 26–29 or less | 27–42 | 36–45 or higher 17.36–20.39 |
| 4–5 | 29–32 or less | 30–49 | 45–52 or higher |
| 5–6 | 32–36 or less | 34–56 | 45–60 or higher |
| 6–7 | 36–40 or less | 38–64 | 60–69 or higher |
| 7–8 | 40–44 or less | 42–73 | 69–80 or higher |
| 8–9 | 44–49 or less | 47–84 | 80–92 or higher 36.22–41.81 |
| 9–10 | 49–55 or less | 52–96 | 92–106 or higher |
| 10–11 | 55–61 or less | 58–110 | 106–121 or higher |
| 11–12 | 61–69 or less | 65–123 | 121–136 or higher |
| 12–13 | 69–76 or less | 73–135 | 136–149 or higher |
| 13–14 | 76–83 or less | 81–144 | 149–159 or higher |
| 14–15 | 83–90 or less | 88–151 | 159–167 or higher |
| 15–16 | 90–94 or less | 94–155 | 167–172 or higher 75.82–78.05 |
| 16–17 | 94–98 or less | 99–158 | 172–175 or higher |
| 17–18 | 98–100 or less | 102–160 | 175–178 or higher |
| 18–19 | 100–101 or less | 104–163 | 178–80 or higher 80.75–82.02 |
| 19–20 | 101–102 or less | 105–166 | 180–182 or higher |