
BMI and Age: How Does ‘Healthy’ Change at Every Stage?
Wondering how BMI and Age interact?
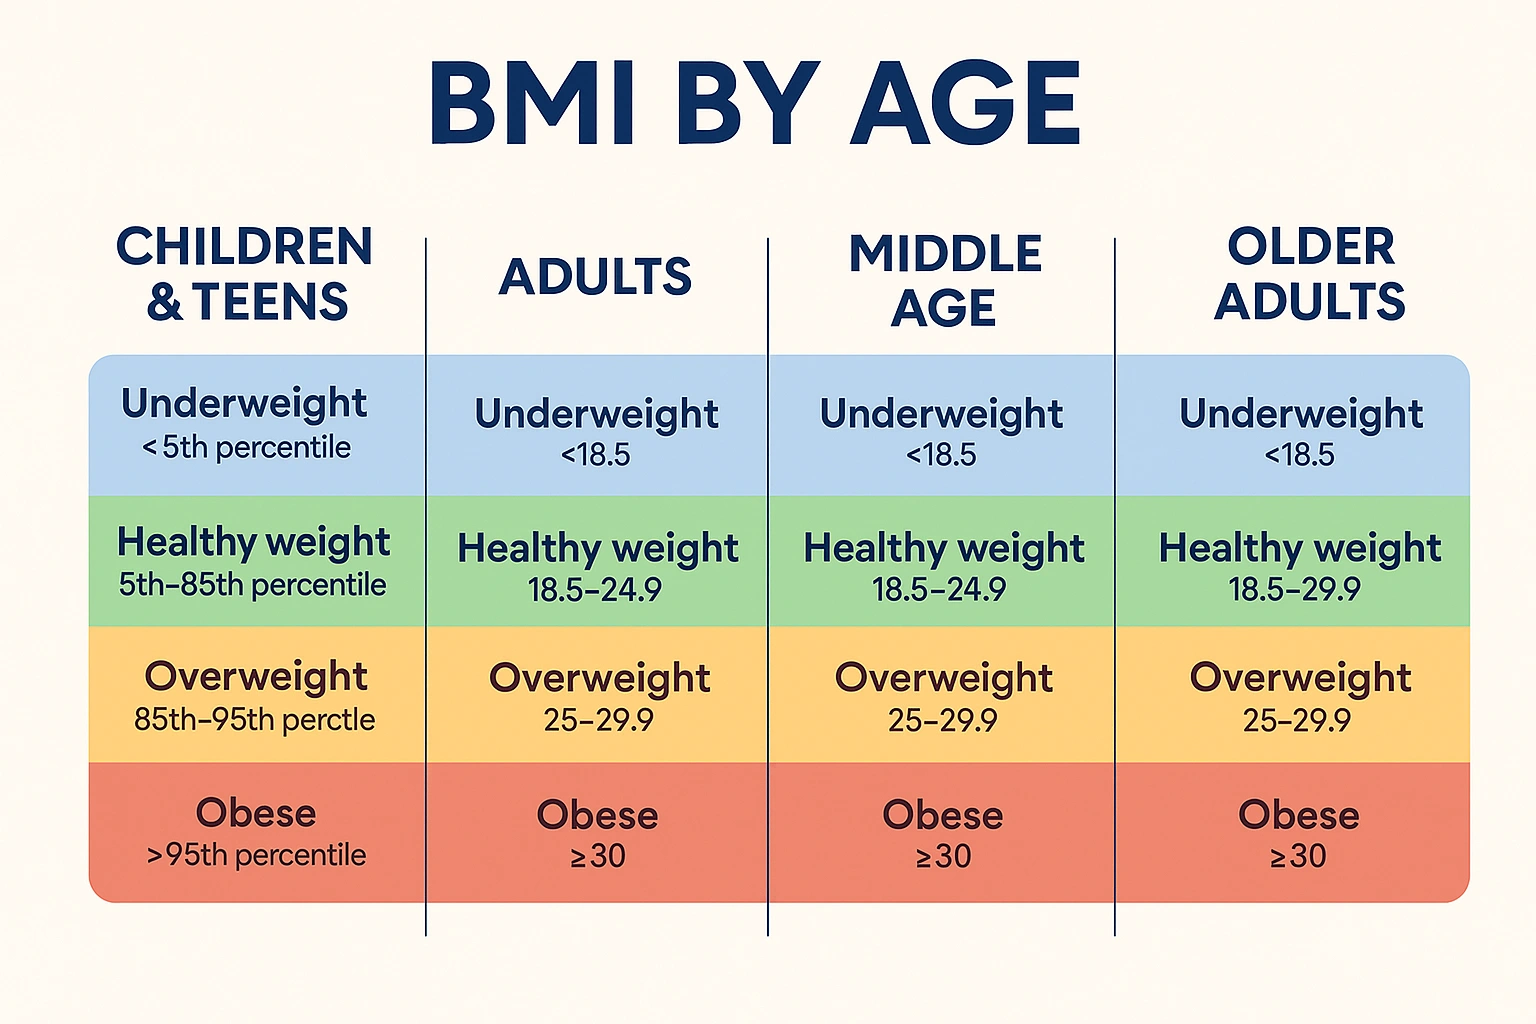
- Kids & Teens: use growth-chart percentiles, not adult cut-offs.
- 20-39: 18.5-24.9 stays the “healthy” sweet spot, but muscle peaks then falls.
- 40-59: metabolism slows; 19-26.4 is a safer target as fat redistributes.
- 60 +: research shows best outcomes at 20-27; a slightly higher BMI can protect against frailty.
Because muscle, bone density and height all shift with time, pair age-adjusted BMI with waist size, strength and activity for a truer health picture.
Body Mass Index (BMI) is a simple calculation using height and weight to assess if a person is underweight, at a healthy weight, overweight, or obese. While BMI is widely used as a quick health assessment tool, one crucial factor often overlooked is age. As we move through different life stages, natural shifts occur in body composition, metabolism, and overall health, all of which can impact BMI.
In this article, we’ll explore the relationship between BMI and age, how BMI changes over a lifetime, and why considering age-adjusted BMI might provide a more accurate picture of health.

Understanding BMI and Its Limitations
BMI is calculated using the formula:
BMI = weight (kg) / height² (m²)
Weight
Height
Age

You can access your BMI score right now using our BMI calculator. The resulting number is classified into the following categories:
- Underweight: BMI < 18.5
- Normal weight: BMI 18.5–24.9
- Overweight: BMI 25–29.9
- Obese: BMI ≥ 30
While BMI is a useful screening tool, it doesn’t account for factors like muscle mass, bone density, or fat distribution, and it also doesn’t consider age. This is where the concept of BMI by age becomes important, as changes caused by the stages of life in the body can directly influence your BMI score.
How Age Impacts BMI
1. BMI in Childhood and Adolescence
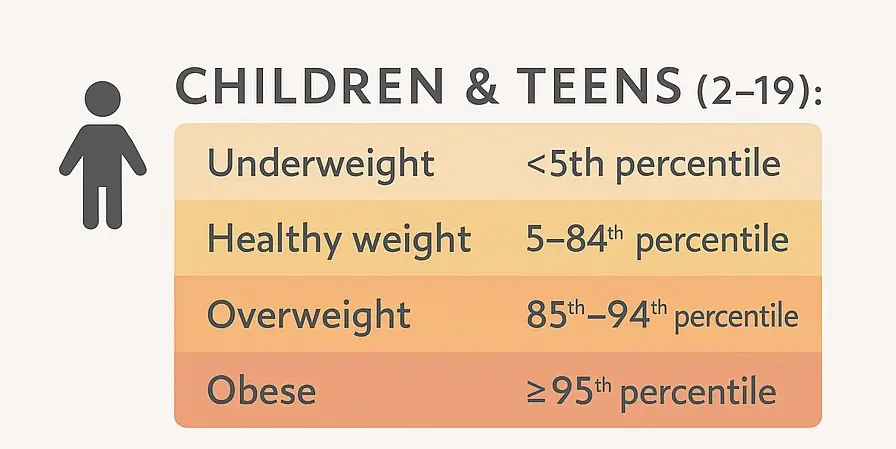
In children and teenagers, BMI is assessed differently compared to adults. This is because children’s bodies are still developing, and their height and weight change rapidly. Instead of fixed BMI categories, BMI percentiles are used to compare a child’s BMI to others of the same age and sex.
For example:
- A child with a BMI in the 5th percentile is considered underweight.
- A BMI in the 85th to 95th percentile indicates overweight.
- A BMI at or above the 95th percentile is classified as obese.
During adolescence, hormonal changes and growth spurts can cause dramatic changes in teens’ BMI. It’s normal for BMI to fluctuate during these years, which is why age-adjusted BMI charts are critical for assessing health in children and teens.
2. BMI in Early Adulthood (20s and 30s)
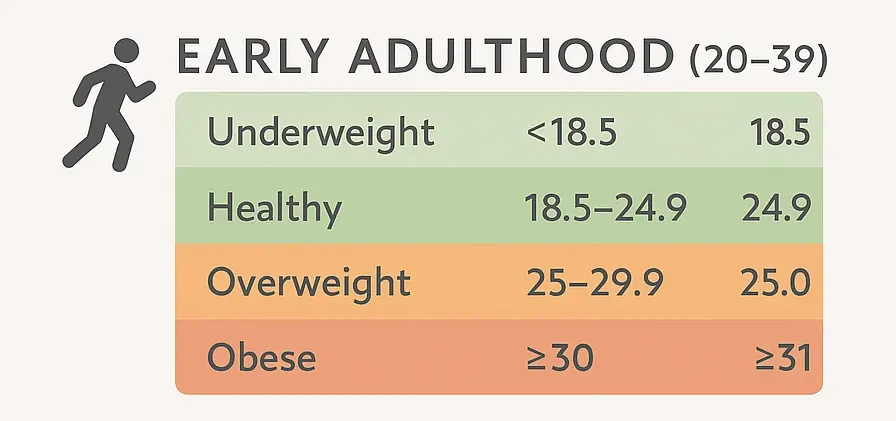
In early adulthood, most people reach their peak muscle mass and bone density. For many, BMI in adulthood tends to remain stable if they maintain a balanced diet and an active lifestyle, for example, by engaging in cardio workouts. However, metabolic rate usually starts to decline slightly during the late 20s, which means maintaining a healthy weight may require more conscious effort.
3. BMI in Middle Age (40s and 50s)
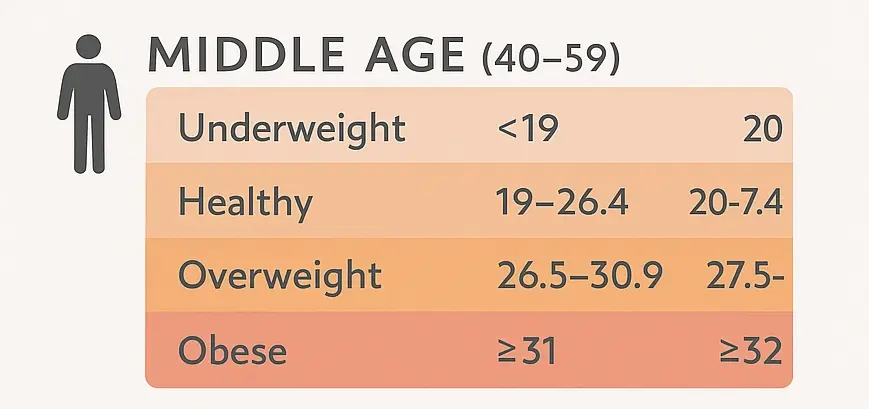
As people enter their 40s and 50s, natural declines in muscle mass (sarcopenia) and metabolism become more pronounced. This often results in an increase in body fat, particularly around the abdomen. That’s when you feel the need to incorporate some belly fat exercises into your routine.
For individuals in this age group, a BMI that was considered “normal” in their 20s may no longer reflect their current health status. For example, someone with a high muscle mass in their youth might see a rise in BMI due to fat accumulation in middle age.
Age-adjusted BMI becomes particularly useful at this stage, as it accounts for these natural changes and provides a more realistic view of health risks.
4. BMI in Old Age (60 and Beyond)
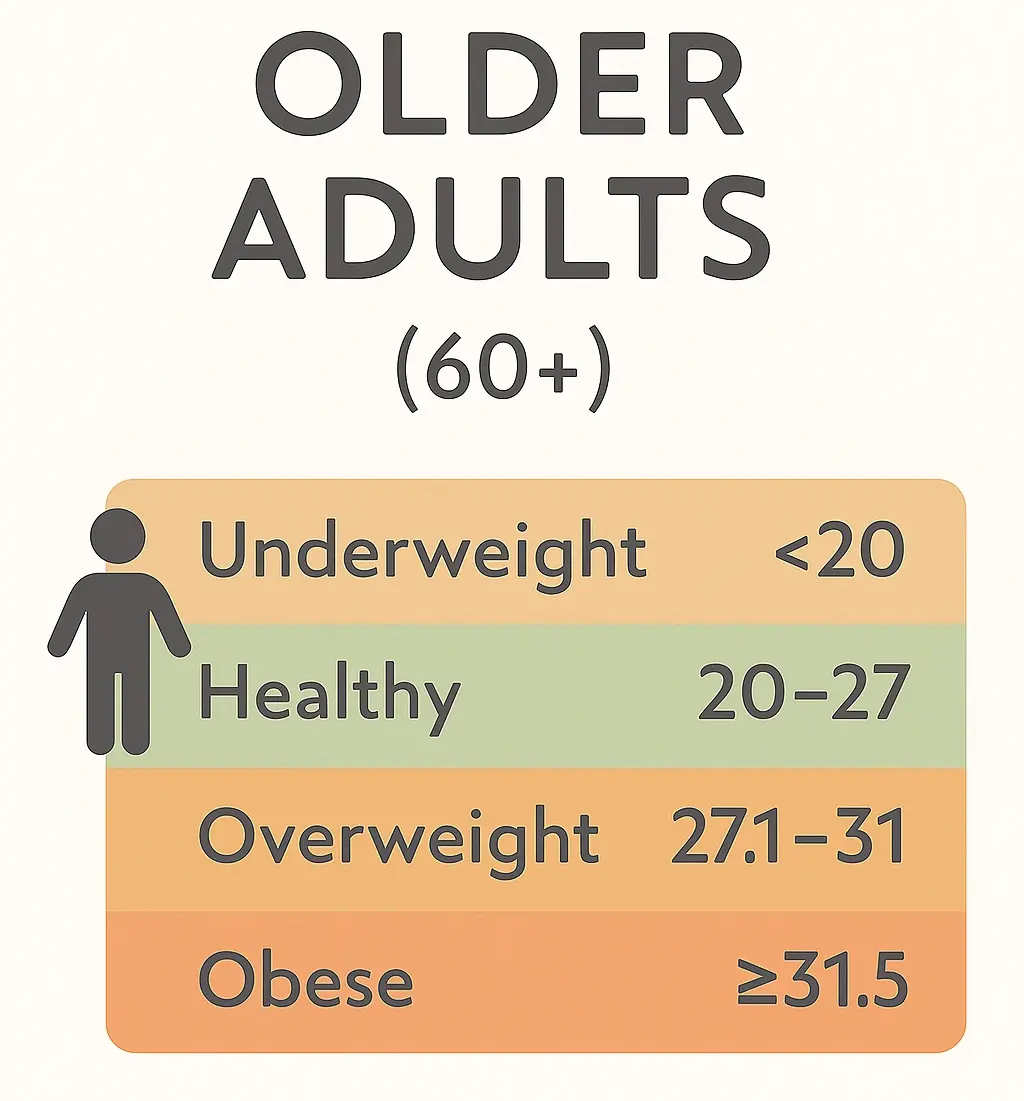
The BMI in older adults can behave very differently due to significant changes in body composition. Muscle mass continues to decline, and some people may lose height due to spinal compression or other factors. This can result in a misleadingly high BMI, despite having less muscle and body fat than a younger individual with the same BMI score.
Interestingly, research suggests that slightly higher BMI scores in older adults (sometimes categorized as “overweight”) may be associated with better health outcomes and lower mortality rates compared to lower BMI scores. This phenomenon, known as the “obesity paradox,” challenges the traditional BMI categories for seniors.
For older adults, assessing health based on BMI alone isn’t enough. Other factors, such as waist circumference, muscle strength, and overall physical function, are equally important.

Age-Adjusted BMI: A Better Approach
Given the natural changes in body composition over time, age-adjusted BMI offers a more nuanced way to evaluate health. Instead of applying the same BMI categories to everyone, regardless of age, this approach adjusts thresholds to account for differences related to any specific stage of life.
For example:
- A BMI of 27, which is considered “overweight” for a younger adult, might be perfectly healthy for an older adult.
- Conversely, a BMI of 18.5 (lower end of “normal”) might indicate malnutrition or frailty in a senior.
Healthcare providers often use additional tools, like body fat percentage, waist-to-hip ratio, and functional fitness tests, alongside BMI to get a comprehensive picture of health at any stage of life.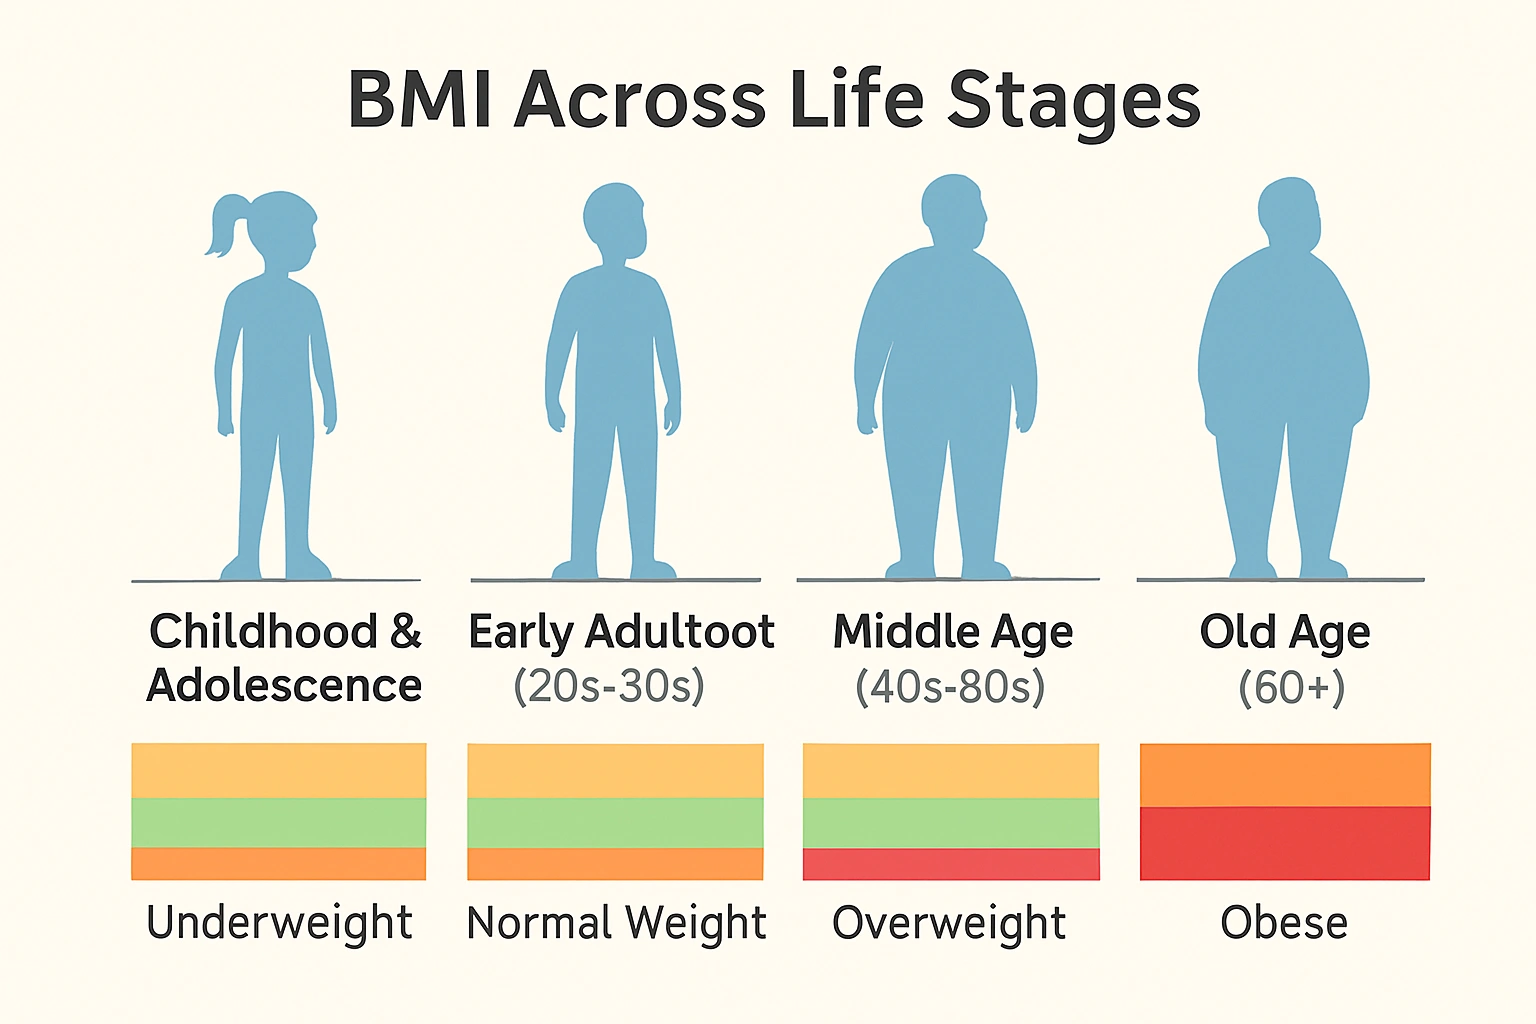
How to Maintain a Healthy BMI Across Life Stages
While changes in BMI are natural over the years, certain lifestyle habits can help you maintain a healthy weight and promote overall well-being:
1. Stay Active

Engage in regular physical activity, including strength training and cardio, to maintain muscle mass and support metabolic health.

2. Eat a Balanced Diet
Focus on nutrient-dense foods like vegetables, fruits, lean proteins, whole grains, and healthy fats. Adjust portion sizes as your metabolism changes with age.

3. Monitor Changes
Regularly track your weight, waist circumference, and physical performance. These indicators can provide valuable insights beyond BMI.

4. Seek Professional Guidance
Consult with a healthcare provider or dietitian to determine an appropriate BMI range for your age and lifestyle.
In case you need help losing weight, you can always try our non-surgical fat loss methods, offered by elegant hoopoe in Dubai.

Final Thoughts: BMI and Age
The relationship between BMI and age is complex. It’s influenced by natural shifts in body composition, metabolism, and health needs over time. While BMI remains a useful tool for assessing weight-related health risks, it’s not a one-size-fits-all measure—especially when age is factored in.
By considering age-adjusted BMI and using additional health metrics, individuals and healthcare providers can gain a more accurate understanding of overall health and well-being. Whether you’re in your 20s, 50s, or beyond, adopting healthy lifestyle habits and ongoing weight management strategies will help you maintain a balanced BMI and enjoy a vibrant, active life at any stage.
References